
Adoptees and genealogists can now benefit from the DNA relationship data compiled by blogger Blaine Bettinger from more than 10,000 pairs of autosomal test results.
While it’s easy to calculate the expected amount of shared DNA for a specific relationship, this study helps us understand the amount of variation that may occur.
Relationship Testing Objectives
Many adult adoptees are now using DNA tests to find their first families. Often, however, their biological parents are no longer alive or willing to confirm the relationship.
Fortunately, adoptees will often uncover another close relative, e.g. a half sibling, an aunt, or a first cousin. By measuring how much DNA they have in common, the adoptee can confirm that he or she has indeed found the correct family.
A surprising number of adults suspect that the man who raised them is not actually their biological father. Yet demanding a paternity test is either awkward or impossible.
These new tests let people answer the question indirectly. For example, testing yourself and a brother or sister can reveal if you are actually full siblings (with two parents in common) or half siblings (with only your mother in common).
Autosomal DNA Tests
There are three autosomal DNA tests that measure how much DNA any two people have in common:
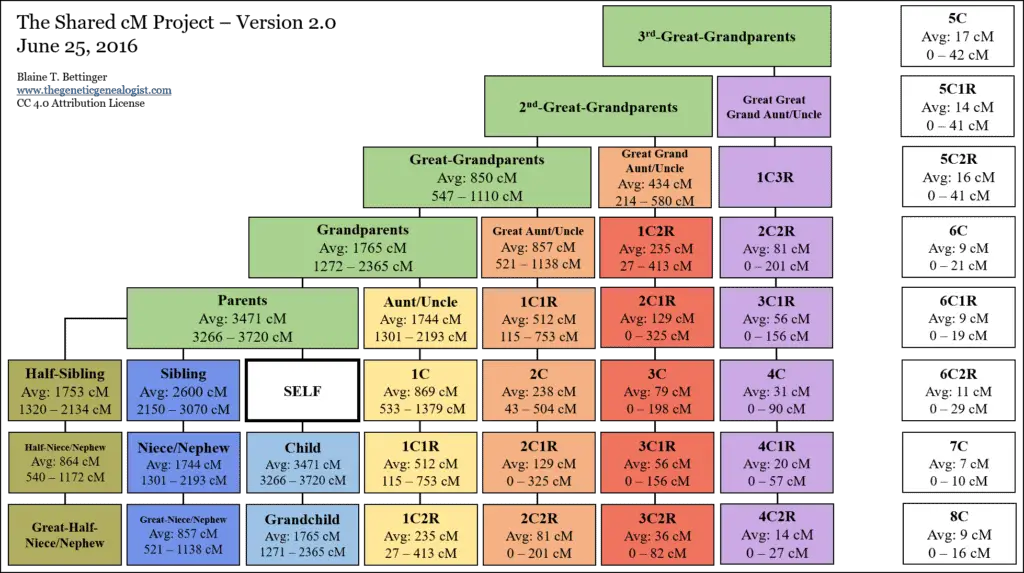
The DNA Relationship Chart
The following chart maps the various relationships in a family tree. This updated chart, known as Version 2.0, has removed the self-reported data points that were obviously outliers.
Within each box the first number is the average amount of shared DNA in centiMorgans. Below that is the range from minimum to maximum reported.
Looking at Siblings and Half Siblings
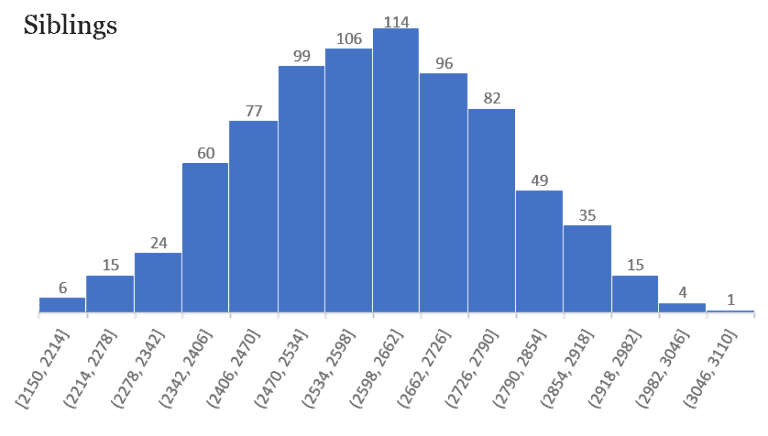
Blaine’s Update includes histograms for many of the relationships. This shows how the data is distributed about the mean.
The following histogram for full siblings shows a virtually perfect bell-shaped distribution.
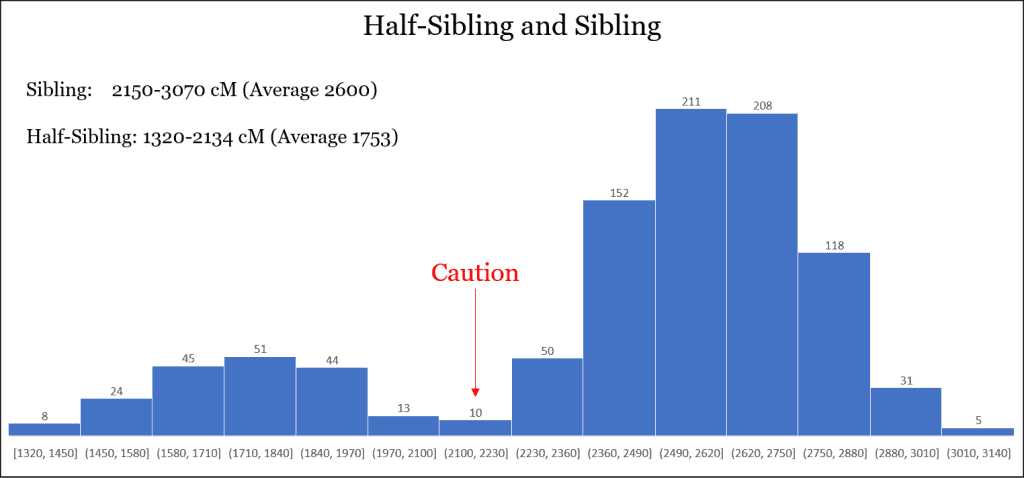
The following image shows the ranges of data for both siblings and half-siblings. While there is no overlap, the difference between the maximum reported data for half-siblings and the minimum for siblings is only about 15 cM.
For more information on the three autosomal DNA tests used for this study, click the following links:
For many more ways to look at the data see Update to the Shared CM Project.
You can follow Blaine through his excellent blog The Genetic Genealogist.